
We make it easy to find impactful business drivers using a single consolidated analysis view. Below we go into detail of what is available as of 6–17–2020 in the Alpine IQ Retail Platform. If you enjoy our insider articles please follow our blog and give this post a clap at the bottom of the page.
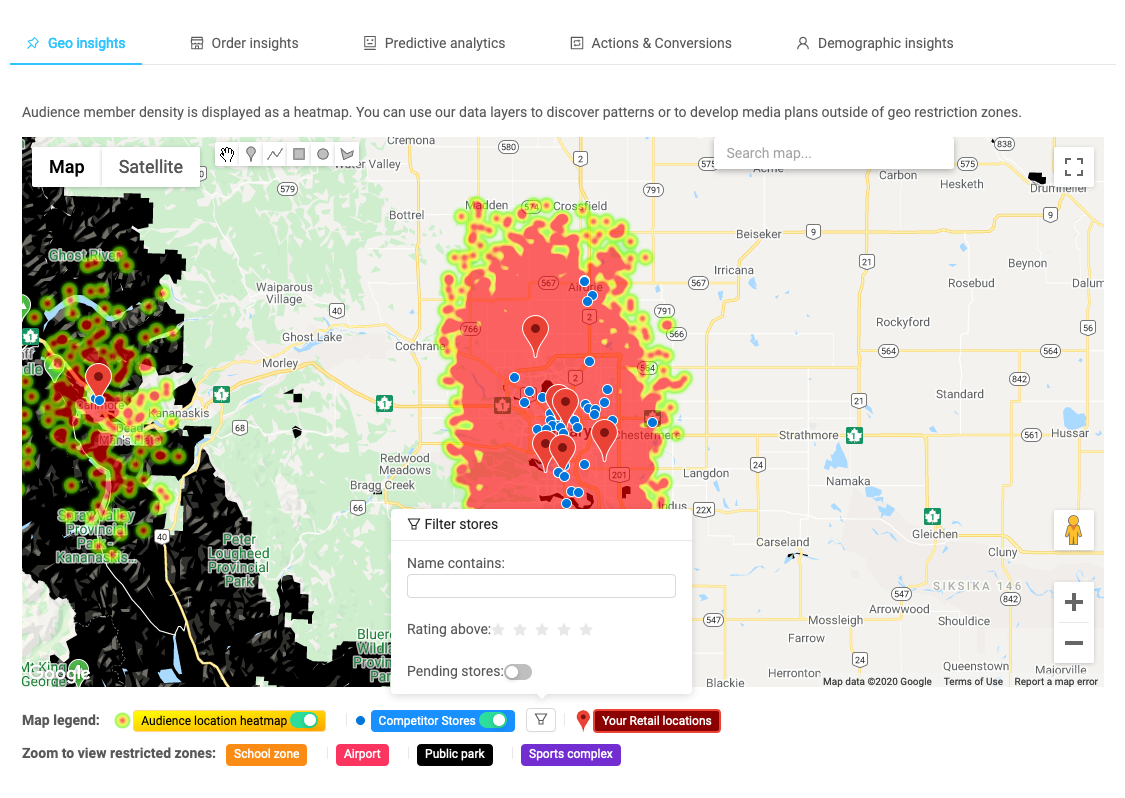
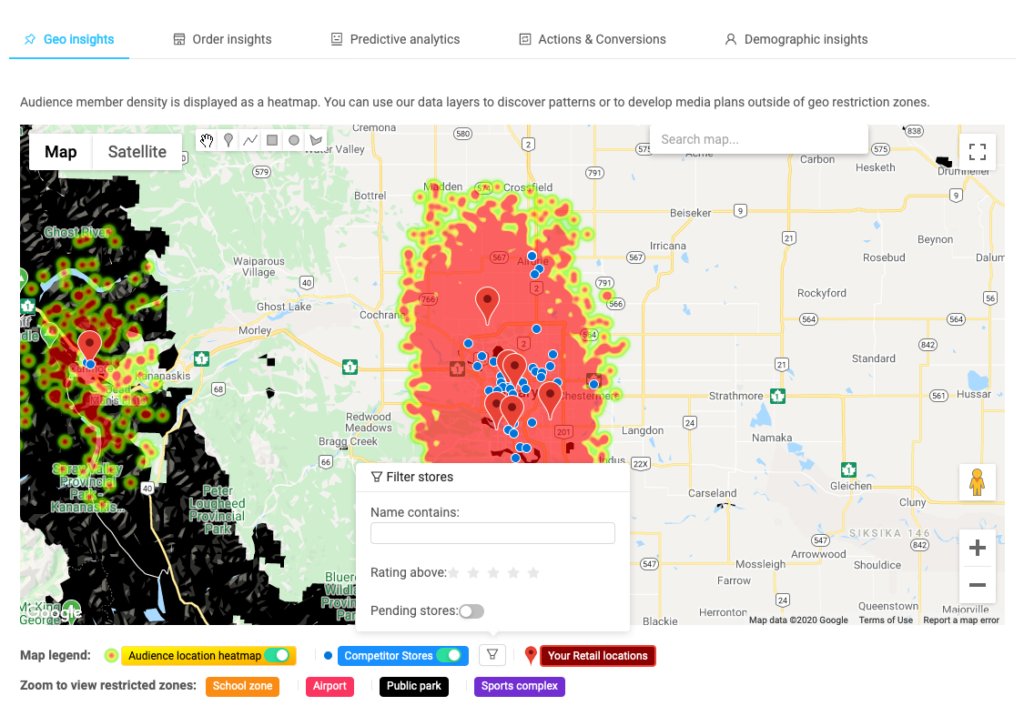
1.) Geo insights
Provides you with a global view of customers for your selected audience, brand, company, or enterprise. The map generally has a heat map of customer locations as well as relevant retail locations. When zoomed in, the map will have zones color-coded for common geo-restricted areas such as schools, public transport, e-sports complexes. Customers use this insights page to discover potential M&A targets, licensing opportunities, locations for legal promotion of goods, and much more.
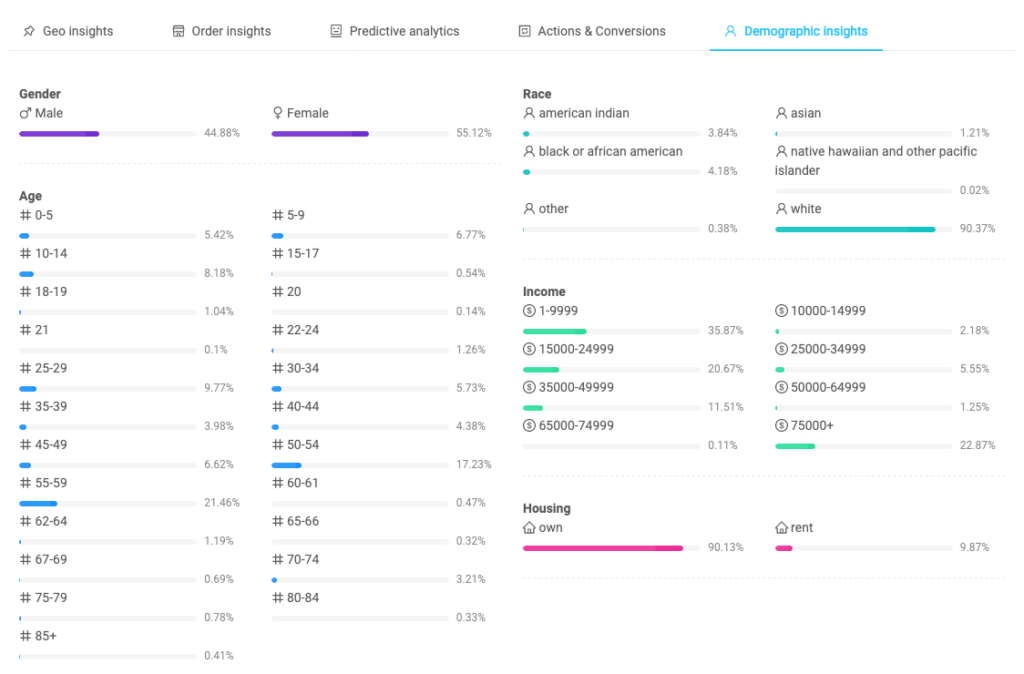
2.) Demographic insights
Contains breakdowns for gender, age, race, income, and housing in percentages based on what is selected.
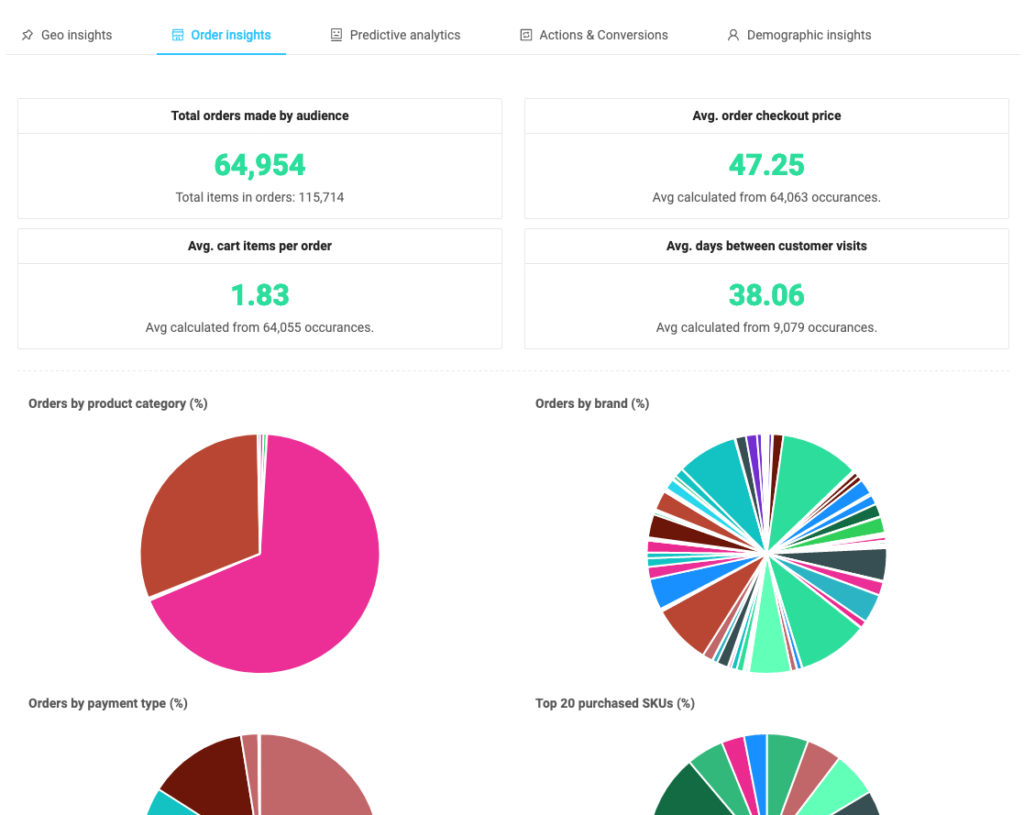
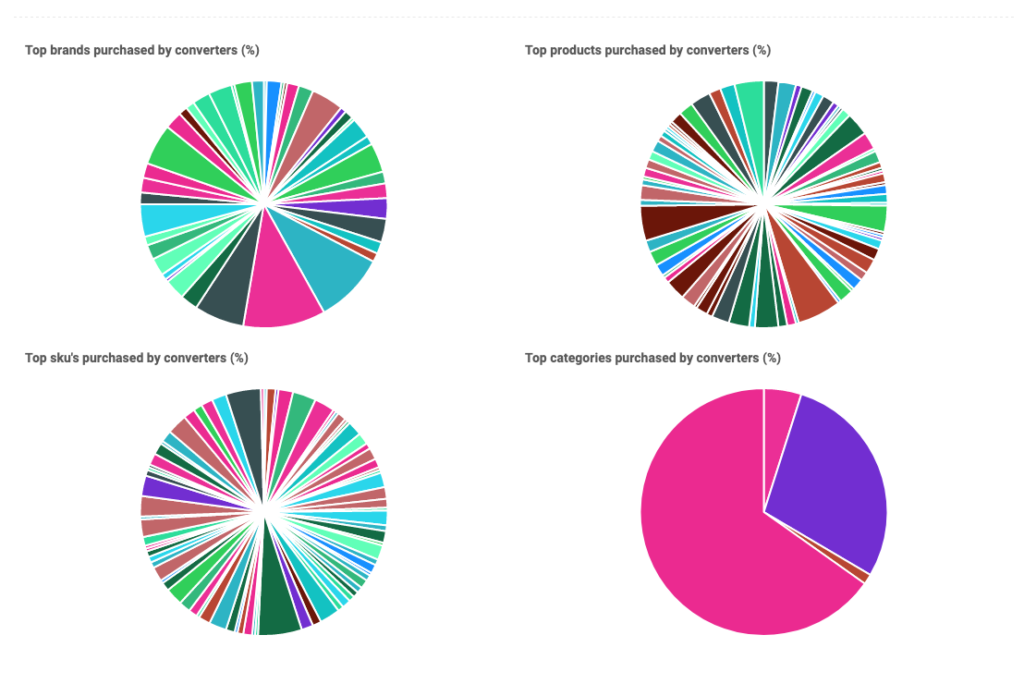
3.) Order insights
An overview of analytics related to orders made via e-commerce or in-store transactions.
- Total orders
- Avg. order checkout price
- Avg. cart items per order
- Avg. days between customer visits
- Number of orders by product category
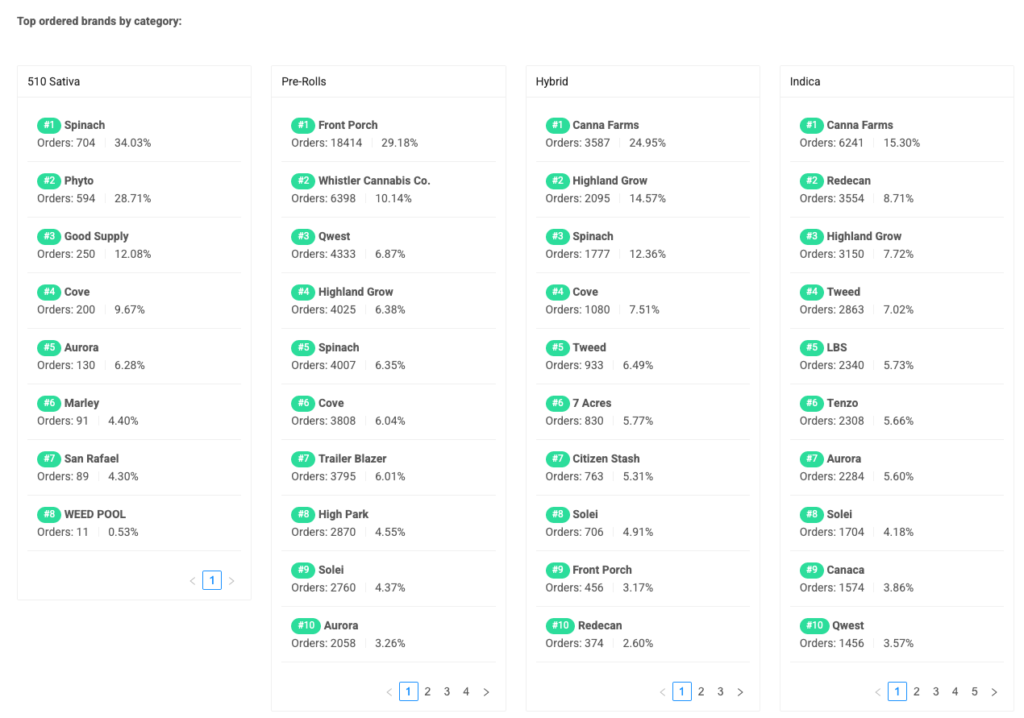
- Number of orders by brand
- Number of orders by payment type
- Top 20 purchased SKU’s across all orders
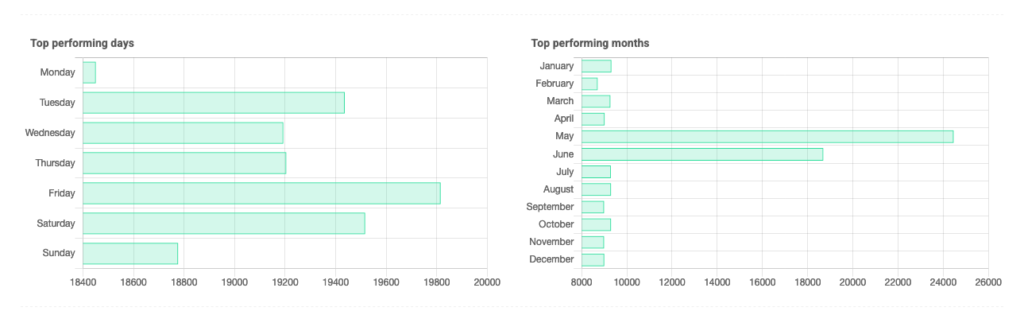
- Orders by day of the week
- Orders by month
- Top performing products by category
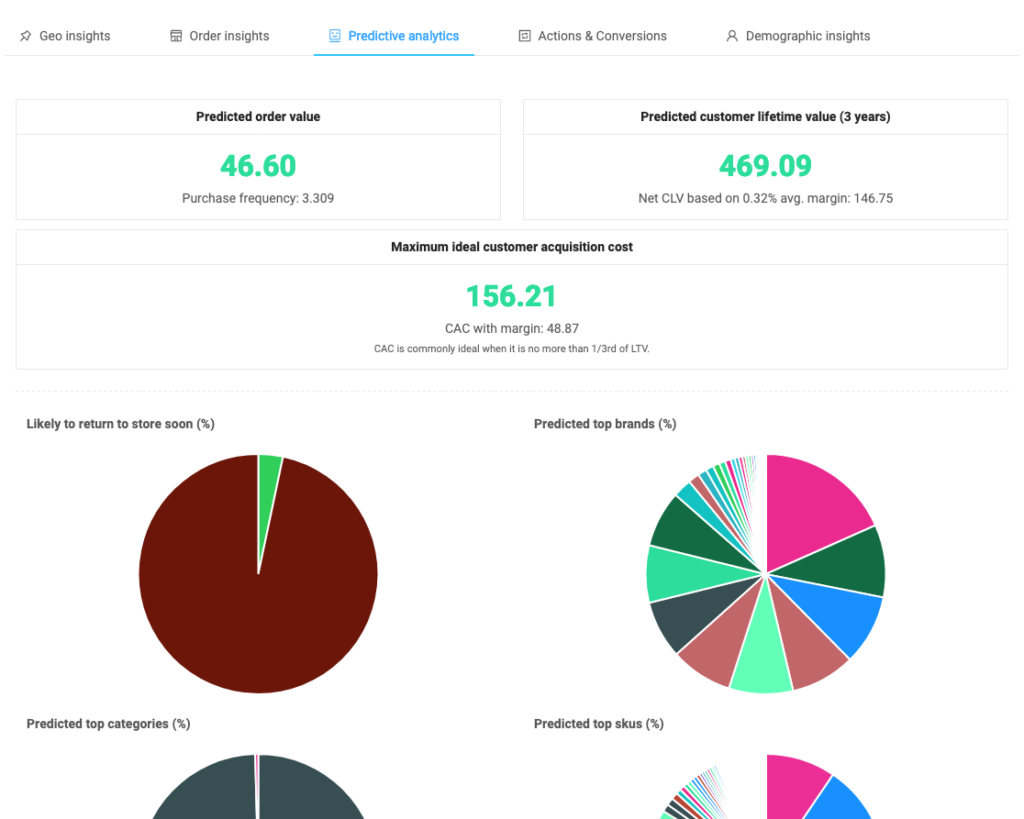
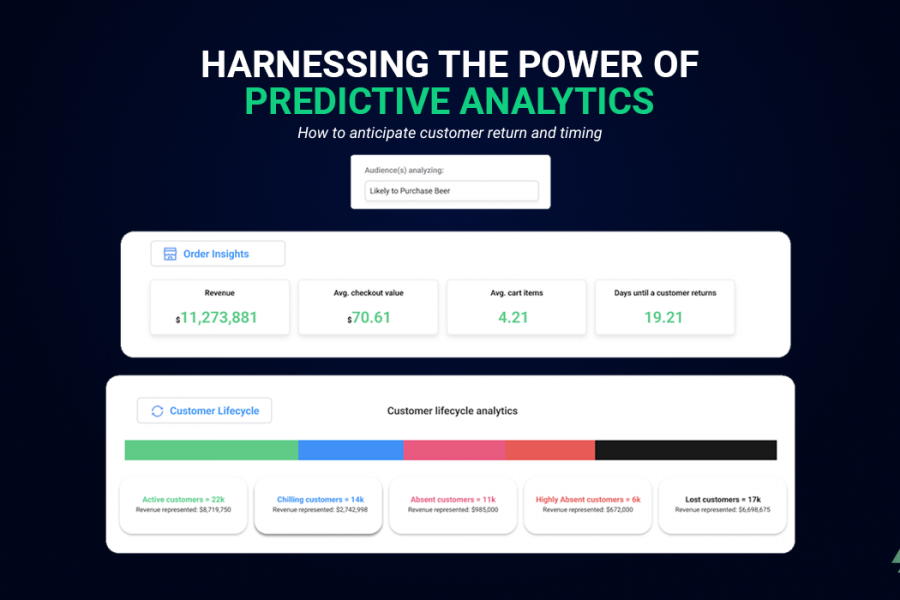
4.) Predictive analytics
Machine learning derived insights related to orders and geo signals.
- Predicted purchase frequency
- Predicted order value
- Predicted customer lifetime value over 3 years
- Net CLV based on actual margin
- Maximum ideal customer acquisition cost
- Maximum CAC with margin taken into account (Uses 1/3rd rule)
- Likely to return to the store soon (Tells you what percentage of users in an audience who are within 30% of the median time between store visits.)
- Likely to be in top 20% of spenders (Percentage of audience members that are in the top 20th percentile of customers based on order history)
- Predicted top X (Looks at current users purchases or cart history and predicts SKU pairings/ brands/ and categories a user will buy next.)
5.) Event analytics
Your custom tracking pushes and occurrences for each key/label
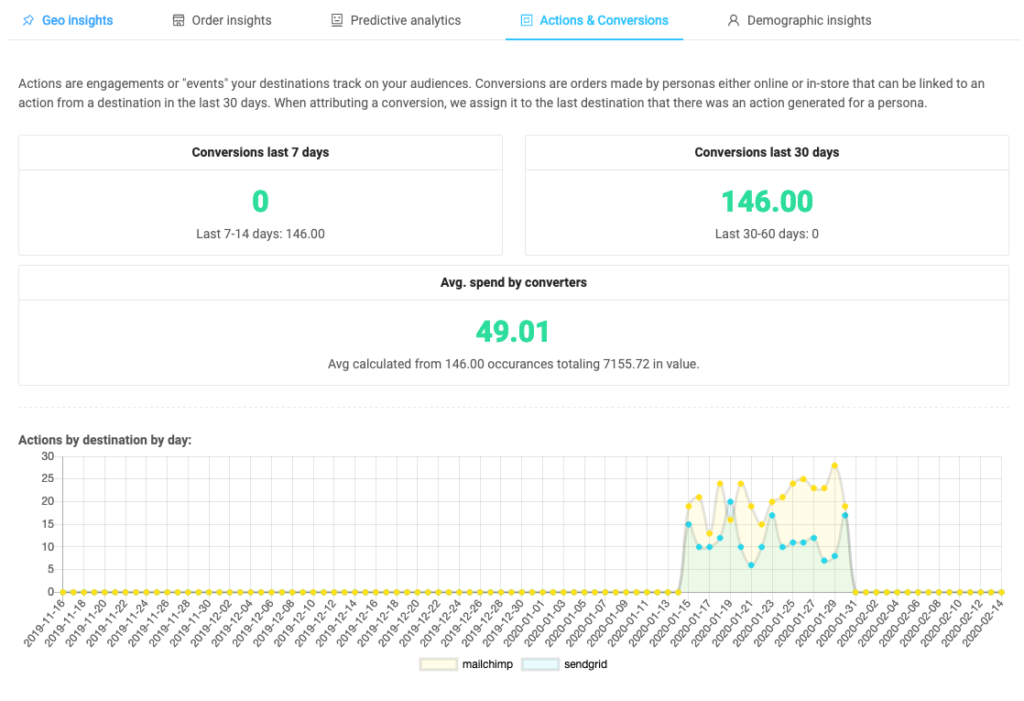
6.) Action analytics
Actions are engagements or “events” your destinations track on your audiences. Conversions are orders made by personas either online or in-store that can be linked to an action from a destination in the last 30 days. When attributing a conversion, we assign it to the last destination that there was an action generated for a persona.

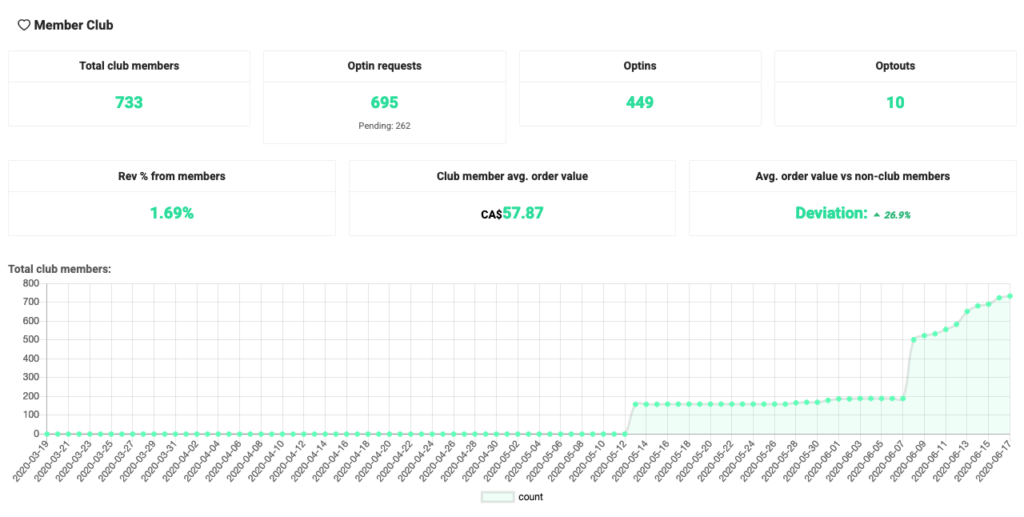
7.) Member club
Member club stats give you exact breakdowns of:
- Total club members
- Optin requests + Pending
- Optins
- Optouts
- Rev % from members
- Club member avg. order value
- Avg. order value vs non-club members
- Total club members by day
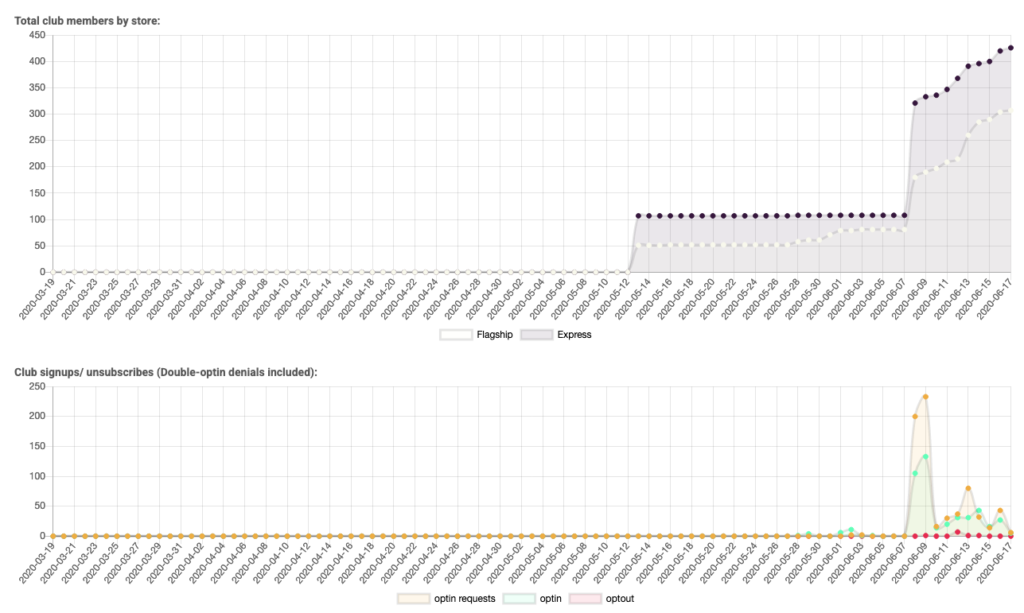
- Total club members by store by day
- Club signups/ unsubscribes/ optin requests sent per day
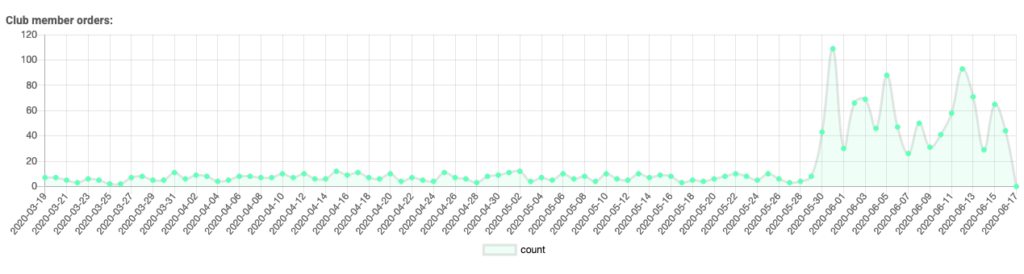
- Club member orders by day
To get the latest updates on our suite of services, make sure to subscribe to our blog today!

Leave a Comment